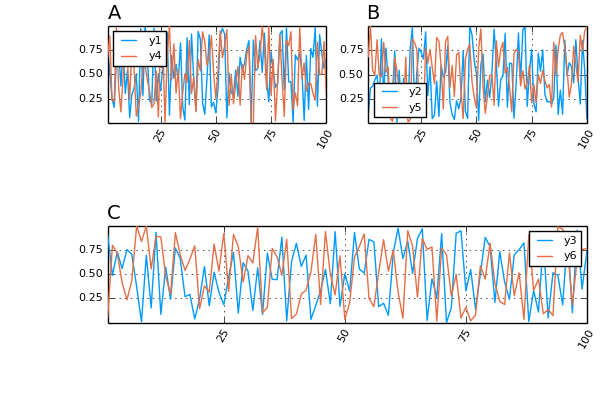
The more I play around with Julia the better things seem to get. With web-stuff on my mind lately from working on MiniHTTP I thought it would be cool to create a simple web API for adding charts to any webpage. Thanks to a couple packages (HttpServer.jl and Plots.jl) this was dead easy in Julia.
The basis for handling requests for charts is by creating a simple HTTP Handler. This checks the URL that was supplied and, if it matches, dispatches the correct chart.
http = HttpHandler() do req::Request, res::Response
  if ismatch(r"^/randomchart",req.resource)
    Response(random_chart(), headers("image/png"))
  elseif ismatch(r"^/linechart",req.resource)
    Response(line_chart(req.resource), headers("image/png"))
  else
    Response(400)
  end
end
Above there are two endpoints that we can match. The first one is if the URL starts with ‘/randomchart’, in this case the function ‘random_chart()’ is called which generates some random numbers and plots them to a chart. The chart at the top of this post in made this way and, since it is random, every time this page is refreshed the chart will be slightly different.
The second endpoint is for generating a custom line chart. If the URL starts with ‘/linechart’ then the function ‘line_chart(::AbstractString)’ is called. This function expects that a query string is attached to the end of the supplied URL that contains a list of x and y coordinates to plot on a line graph. For instance, the URL ‘/linechart?x=1,2,3,4,5,6,7,8,9,10&y=1,2,2.5,2,3,1,1.5,3,0.5,2’ was used to generate the plot below.

And that’s really all there is to it. The full code (which is less than 50 lines!) has been uploaded to my Github if you would like to take a further look. With a little extra work, this could be fleshed out to a very nice and easy-to-use web graphing API for people who just want to be able to quickly add some charts to a website.
Update(20-02-2017): I've shut down one of my Amazon EC2 instances so the charts shown above are now static images instead of dynamically generated from Julia.