Colin is a data analyst, currently working in Whitehorse, Yukon.
Showing blog posts written by: Colin Luoma
Arduino GPS Nixie Tube Clock
Building a clock with nixie tubes is a project that has been done to death already. A quick google search will yield thousands of variants put together by just as many different people. So even though it’s not the most original project, nixie tubes have such a cool look to them I had to make my own anyway. I think the warm glow always catches people’s eye with a look that is somehow both futuristic and retro at the same time.
There were a couple goals that I set for the project. Firstly, I wanted to design as much of the clock as I could. This was made pretty easy by the sheer amount of information available online. As I said, thousands of people have attempted this already and there is no shortage of documentation. The tubes themselves are salvaged IN-14 style tubes produced in the Soviet Union. They even have the CCCP logo printed on the backs of a couple that haven’t yet worn away.
I used the site EasyEDA to design the schematic and PCB board layout. I got the PCB fabricated from there as well and they turned out pretty nice. Although the minimum I could order was 6 so I got a few extras that I’m not sure what to do with. It was cool to design my own board and layout everything the way I wanted it. I had never done any CAD stuff before so it was a fun experience.
Another thing I really wanted for the clock was accurate timekeeping. I found that using the internal clock from the Arduino was pretty inaccurate as over time it would fluctuate for many different reasons. Another option was to use a real-time clock chip, like those in digital watches. But I decided against it because even watches can drift by a minute or two over several months. The final option, and the one I went with, was to use a GPS chip. Going with GPS means that the clock will always have exactly GMT time, as provided by the satellites. Which means I only have to adjust the hour instead of setting the whole time when resetting it. Of course, if you live somewhere strange, like Newfoundland with a half timezone, the minutes will still need to be adjusted too.
My board design is uploaded here if you'd like to take a look or get your own fabricated.
And the Arduino code is, as always, on my Github.
Tags:
Change Ubuntu Root Password Using Dirty COW
If you've been on the internet over the past couple of weeks then you've likely heard of the so-called Dirty COW bug recently discovered in Linux. The story behind it is actually kind of funny. It was discovered and patched by Linus himself over 11 years ago! The fix was then undone in subsequent code commits due to issues with new code. So the vulnerability has been exploitable since for about 9 years, since 2007. The silver lining is that no examples of this exploit being used have been found in the wild and most popular Linux distros have pushed fixes. Patch your system if you haven't already!
If you're not familiar with what dirty COW does it allows a non-privileged user to write to files that are usually read-only except by root. This is pretty significant and since "everything in Unix is a file" this opens up lots of doors for exploitation. There are plenty of resources online to learn more about how exactly the exploit works, like here, so I won't go into much detail about the exploit itself.
Along with knowledge of the exploit, proof-of-concept code was also released. Basically a skeleton example with just enough code to show how writing to a root-protected file is possible. This is what I used to create a simple command line program that I call Madcow. It takes advantage of the dirty COW exploit to change the root password on an Ubuntu system to whatever the user provides.
Ubuntu stores passwords (sort of) in a file located at '/etc/passwd'. Here is the first couple lines of the one found on my machine:
root:x:0:0:root:/root:/bin/bash

daemon:x:1:1:daemon:/usr/sbin:/usr/sbin/nologin

bin:x:2:2:bin:/bin:/usr/sbin/nologin

sys:x:3:3:sys:/dev:/usr/sbin/nologin

sync:x:4:65534:sync:/bin:/bin/sync

games:x:5:60:games:/usr/games:/usr/sbin/nologin
This file is read-only to all users except root. There's lots of stuff here but the most important information is after the first colon of each line. Right at the top we see 'root' then a colon, a lowercase 'x', and another colon. There can be two types of information here: an encrypted password (storing plaintext passwords in files readable by all users would be silly), or a lowercase 'x'. The lowercase 'x' indicates that the encrypted version of the password is stored in a separate file '/etc/shadow'. That file is readable only by root so changing it is impossible.
So if we want to change the root password all we need to do is replace the single lowercase 'x' with an encrypted password of our choosing. And this is exactly what madcow does. Here is a quick example:
$ head -1 /etc/passwd

       root:x:0:0:root:/root:/bin/bash

$ ./madcow new_password

       mmap 7f4b13aba000

       madvise 0

       procselfmem 2648940

$ head -1 /etc/passwd

       root:xxTumM4gi9IDM:0:0:root:/root:/bin/bash
Not very interesting on the surface, but this is a write-protected file that we, as a normal user, have just written to! Now it's simply a matter of starting a root shell using the new password and the entire system is ours.
That's basically it. I'm sure there are a lot more interesting things that could be done with this exploit but this is the most obvious and powerful. The code is available on my Github if you want to take a closer look. Obviously I take no responsibility for any damage caused to your or others' systems from running this code. And please don't run it outside of a VM or an installation you don't mind losing.
Tags:
Using Julia for Dynamic Charts

The more I play around with Julia the better things seem to get. With web-stuff on my mind lately from working on MiniHTTP I thought it would be cool to create a simple web API for adding charts to any webpage. Thanks to a couple packages (HttpServer.jl and Plots.jl) this was dead easy in Julia.
The basis for handling requests for charts is by creating a simple HTTP Handler. This checks the URL that was supplied and, if it matches, dispatches the correct chart.
http = HttpHandler() do req::Request, res::Response
  if ismatch(r"^/randomchart",req.resource)
    Response(random_chart(), headers("image/png"))
  elseif ismatch(r"^/linechart",req.resource)
    Response(line_chart(req.resource), headers("image/png"))
  else
    Response(400)
  end
end
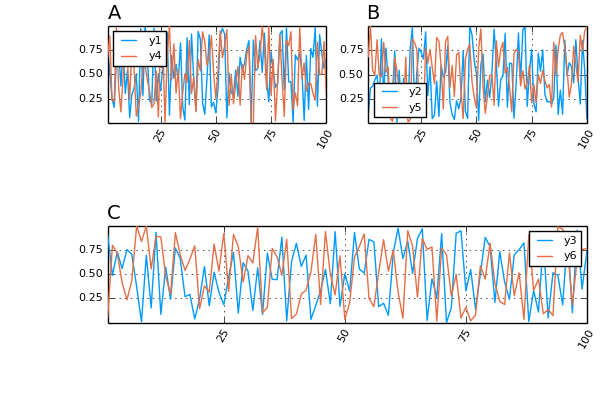
Above there are two endpoints that we can match. The first one is if the URL starts with ‘/randomchart’, in this case the function ‘random_chart()’ is called which generates some random numbers and plots them to a chart. The chart at the top of this post in made this way and, since it is random, every time this page is refreshed the chart will be slightly different.
The second endpoint is for generating a custom line chart. If the URL starts with ‘/linechart’ then the function ‘line_chart(::AbstractString)’ is called. This function expects that a query string is attached to the end of the supplied URL that contains a list of x and y coordinates to plot on a line graph. For instance, the URL ‘/linechart?x=1,2,3,4,5,6,7,8,9,10&y=1,2,2.5,2,3,1,1.5,3,0.5,2’ was used to generate the plot below.

And that’s really all there is to it. The full code (which is less than 50 lines!) has been uploaded to my Github if you would like to take a further look. With a little extra work, this could be fleshed out to a very nice and easy-to-use web graphing API for people who just want to be able to quickly add some charts to a website.
Update(20-02-2017): I've shut down one of my Amazon EC2 instances so the charts shown above are now static images instead of dynamically generated from Julia.
MiniHTTP - Raspberry Pi Webserver
Finally! After over a year of wondering what I should do with my Raspberry Pi, and a forgotten attempt at a weather station, I have found a permanent use for the Raspberry Pi.
Recently I took my website off blogger and wrote my own from scratch. This started a chain reaction and got me thinking: “If I’m already writing a website, why not write a webserver to go along with it?” And as a result, I’ve been spending the majority of my spare time learning about and writing a C webserver from scratch. A huge thanks to Beej's guide that got me rolling on this project.
It’s called MiniHTTP (not very original I know) and it’s finally in a semi-working state. Good enough for my purposes anyways. It’s more of a prototype and a learning project than a piece of code that should ever be used by anybody else for anything other than education. It’s rather inefficient due to forking processes to handle each request and it supports only a small subset of HTTP. But I wanted to keep it small a purpose-built for my application since it will be running on a Raspberry Pi I didn’t want the project to get too big.
Now the Raspberry Pi comes into play. My version 2 has been sitting in the closet for quite some time now. Soon after starting to work on MiniHTTP I made the decision to host everything on my Pi for a couple of reasons. First, while Amazon AWS is pretty awesome, it’s quite expensive for hosting my small site that barely gets any traffic. And second, because it’s awesome! Hosting my own site on my own hardware, that only cost 35 bucks! Actually twice that with the cost of the PiDrive. But still pretty dang cheap. And if it holds up for more than 7 months it will have been cheaper than continuing to pay for an EC2 instance on Amazon.
And of course it isn’t a true Raspberry Pi project without an unnecessary glowing blue LCD display. So along with the webserver a small python script is also running in the background that reads from the server log file to show hourly, daily, and weekly website hits.
Tags:
Mission: Economy - Düsseldorf Hackathon
Over the past weekend I participated in my first ever hackathon here in Dusseldorf. The theme described on the event page was rather vague and didn't really have any clear direction so we weren't sure what exactly to expect. Before arriving we had decided that we wanted to do something interesting and/or fun with the Panama papers data that was released publicly.
Eventually we decided to create a simple website to 'Build Your Own Offshore Corporation', poking fun at the ridiculousness of the companies (if you can even call them that) mentioned in the papers. Using the actual data pulled from the papers we allow the user to generate a name, locate an intermediary to help set up their corporation, and decide which tax jurisdiction to have the company operate in. We used R Shiny to build a quick prototype. It isn't hosted online anywhere but if you clone our github repo you can run it locally.
The funniest part for us was seeing how silly the actual companies names are. A couple of our group member put together the graphic above, using the most common words found in the names. Give it a try to see for yourself!
At the conclusion of the event we ended up taking home the prize for 'Best Pitch'. Which was quite a surprise to us as it seemed that our project was probably not what the judges were really looking for. So all-in-all not a bad way to spend a couple days. It was definitely an interesting experience for my first hackathon.
Finally I'd like to thank everybody in our group that participated! Without them this would not have been quite so successful or fun.
Tags:


