Author

Colin is a data analyst, currently working in Whitehorse, Yukon.

Showing blog posts written by: Colin Luoma

Bitcoin Prices and Hidden Markov Models

Lately, there’s been a lot of interest in Bitcoin, probably sparked by its almost unbelievable growth in December 2017. However, this past week, we saw the price of Bitcoin drop the just above $6000 which was the lowest it has been since November 2017. So I wanted to take a closer look at Bitcoin prices through the lens of Hidden Markov Models (HMM) to see what conclusions, if any, can be drawn.

Hidden Markov Models are similar to a standard Markov chain model but the where the current state is unknown. Instead of observing the actual state of the process, the only information available is the realization of some other output that is dependent on the current internal state. A somewhat contrived example would be trying to detect whether it is raining, or not, based on how many people you see with umbrellas. The hidden, unobservable state is the weather (raining or not) while the observable, realization of that state is the proportion of people carrying umbrellas (more people carry umbrellas if it’s raining).

Applying this concept to Bitcoin prices, there could be some internal state driving the change in price and different states produce different expected price changes. I assumed that the daily change in price followed a Log-normal distribution, which means that taking the logged value of daily returns should be normally distributed. This made the model slightly easier to interpret. I also used 3 internal states in an attempt to capture bear and bull states with differing volatility.

Below is a chart showing the most likely states during the 2017 and into the 2018 calendar years:


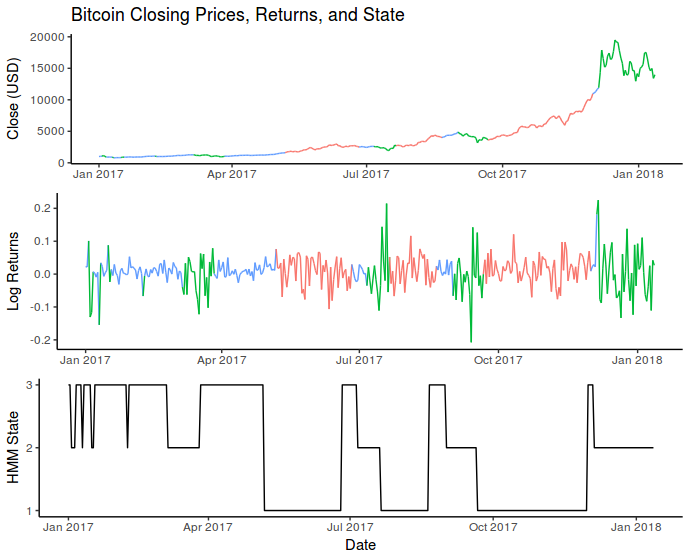
Here each of the three states are coloured. The blue state was characterized by positive average returns and low volatility. The red state also had generally positive returns but higher volatility. Finally, the green state had mostly negative returns and also high volatility.

I also ran a quick Shapiro-Wilk test on the log-valued daily returns which was unable to reject the null that daily returns come from a normal distribution. This means that there wasn’t enough evidence to disprove the assumption that price changes follow a Log-normal distribution.

This is all fine and good, but what would be really cool is if the fitted model could be used to predict the future price of Bitcoin. So I ran 10,000 30-day simulations to get an expected future price and a confidence interval. This is what it looks like:


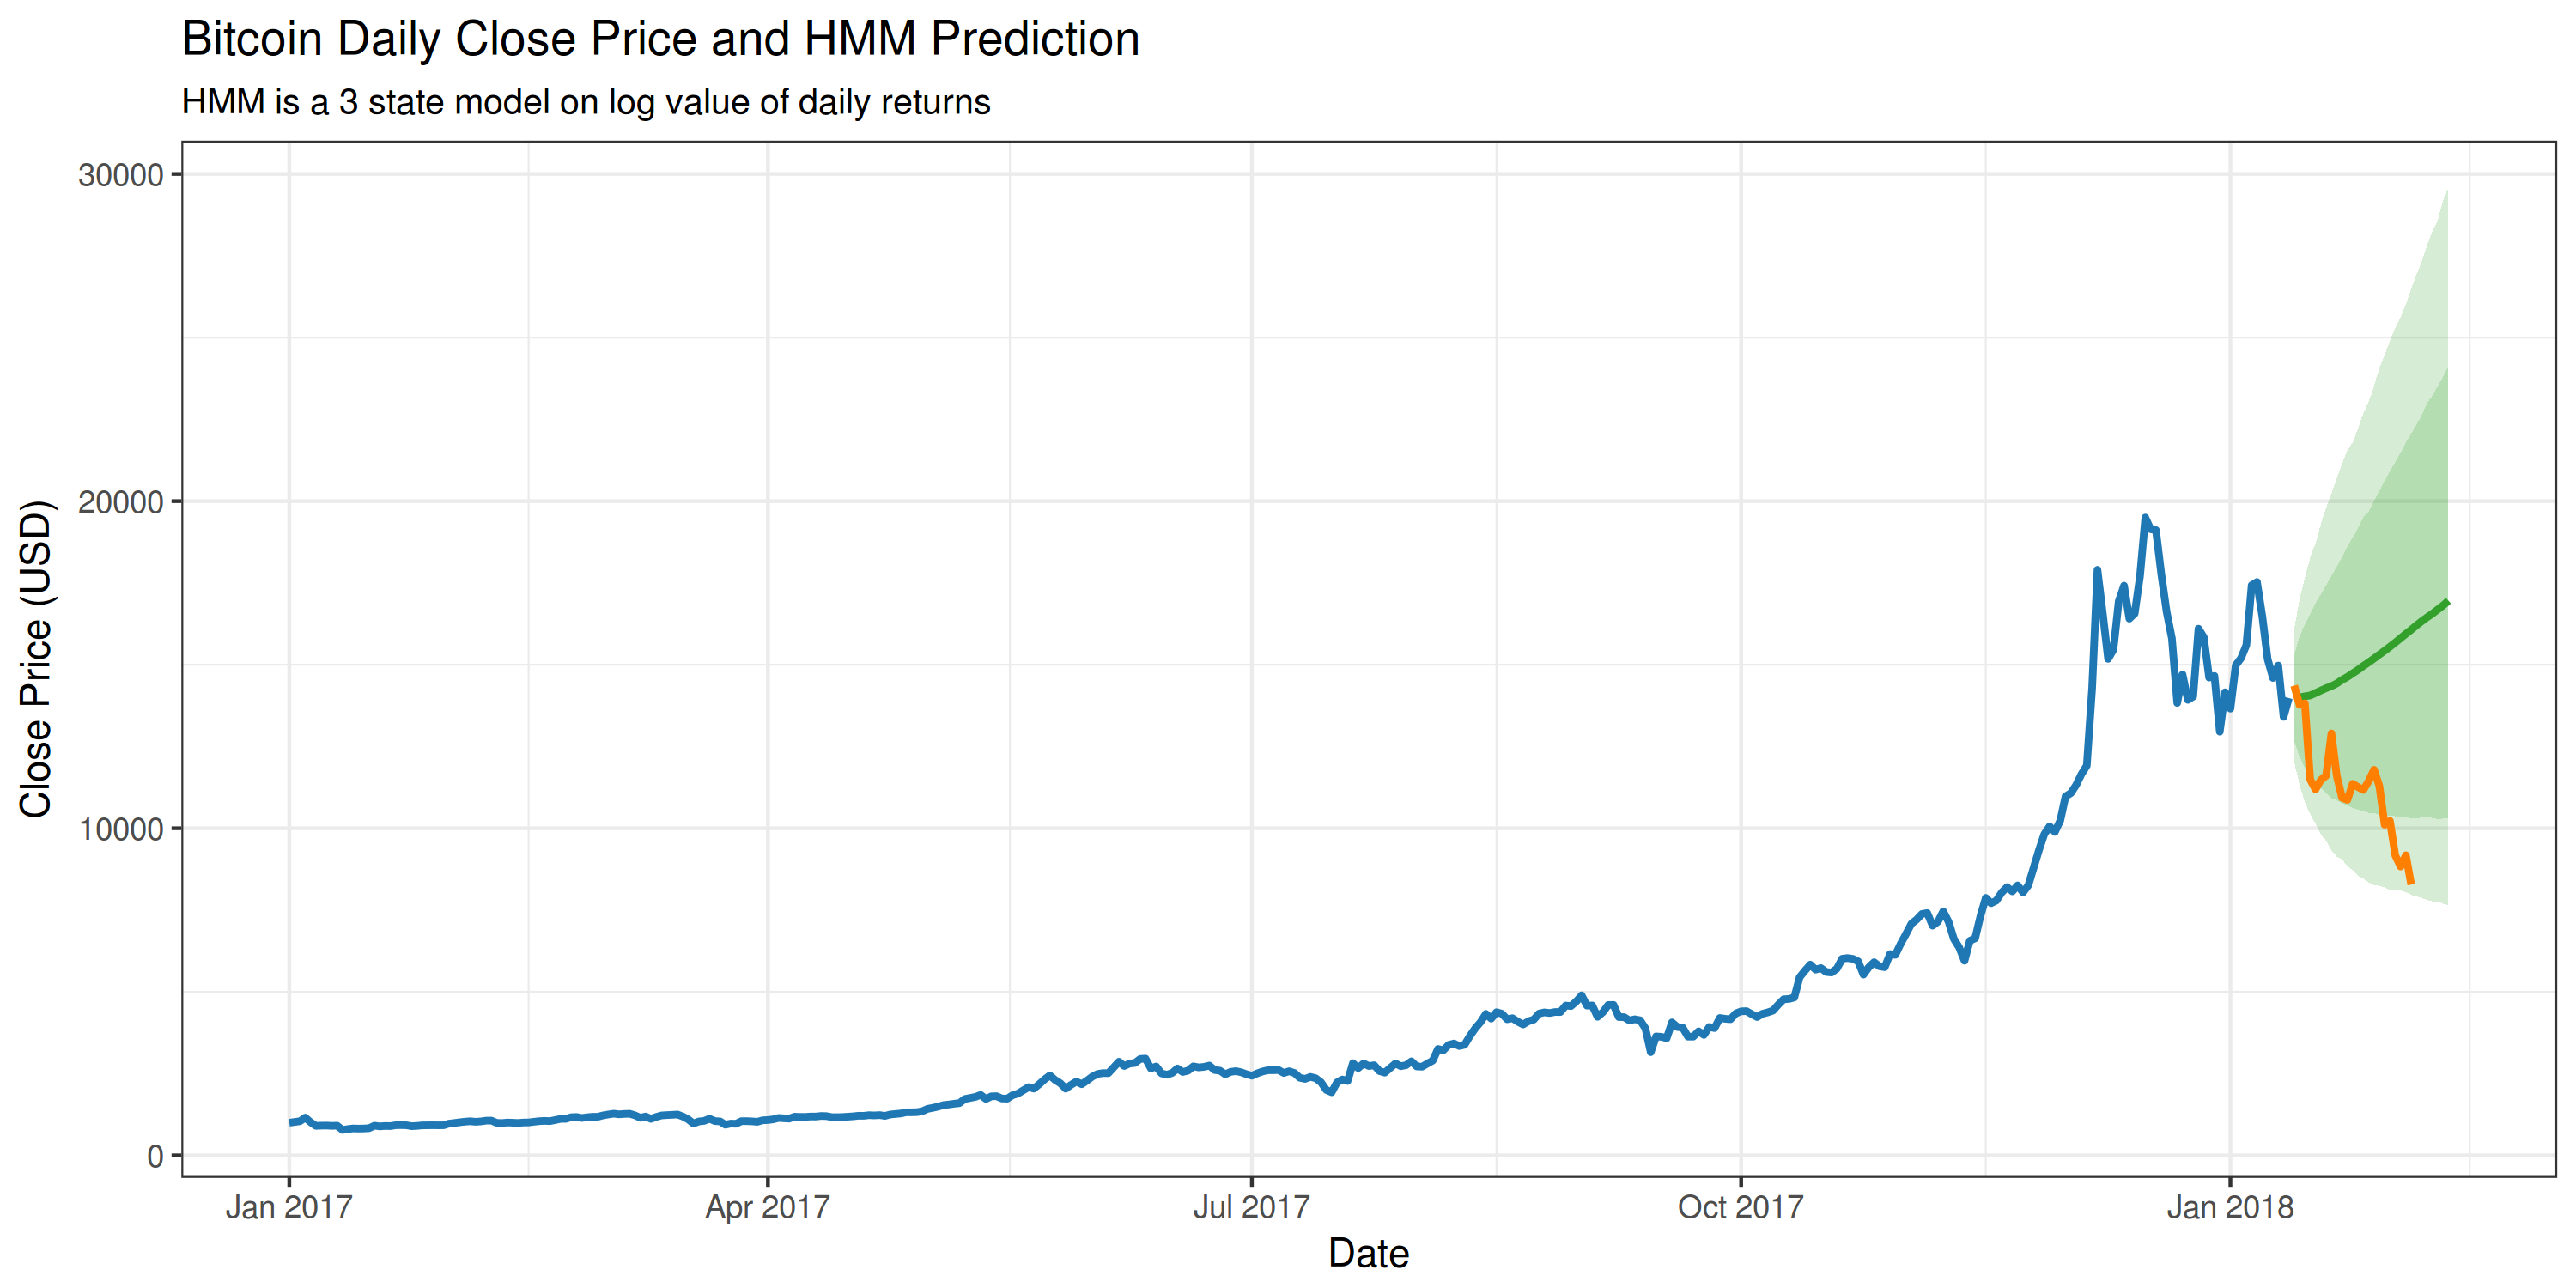
This shows the predicted Bitcoin price, and the actual price change during the prediction interval. The shaded regions also represent the 95% and 80% confidence intervals, based on the 10,000 simulations. In this instance, the HMM was not exactly a great predictor. Bitcoin has been incredibly volatile and I think it’s extremely difficult to make any meaningful predictions using closing price alone.

If you’re interested in taking a closer look at the R code used to fit the HMM model and generate the charts, you can find it on my Github.


Tags:


A New Year - A New Server


There's one guaranteed way to a good start to the new year: new computer hardware! Previously I had been hosting this site on an aging Raspberry Pi 2 and it was due time for an upgrade.

As much as I wanted to stay in the Raspberry Pi ecosystem and move to a Pi 3, Asus' Tinker Board sounded too good to pass up. Its biggest advantage over the Pi is a dedicated Gigabit ethernet adapter, perfect for a webserver. The Raspberry Pi shares its ethernet with the USB circuitry which means slow Megabit speeds. It can also quickly become saturated when reading data from an external USB drive and using the network at the same time.

Moving to new hardware also surfaced some bugs in minihttp so it was nice to further improve the server code as well. So far everything has been running great and I'm really pleased with the speed.

And of course, it's fitted with a new LCD display and a speaker. Similarly to the old server, the LCD cycles between temperature, CPU usage, and website hits. The speaker is set to play a chime whenever somebody uploads an image to our family picture frame.


Tags:


Neural Network from Scratch


It’s been a while since my last machine learning project: implementing a decision tree in Julia. This time I wanted to take a closer look at neural networks. I was recently shown an amazing book 'Neural Networks and Deep Learning' by Michael Nielson. He does a great job distilling the basics to a point where his explanations become intuitive. I won't be able to explain anything as well as he does so please check out his book.

The most basic neural networks are, as it turns out, surprisingly simple. It is possible to derive methods for building and training neural networks using only basic linear algebra and calculus. Neural networks have also been around for quite some time but it wasn’t until backpropagation was suggested as a way of training networks in the 70's that they really took off. The complexity of them stems somewhat from the sheer size of networks. Modern computer hardware and new scientific computing methods were required for neural networks to reach the popularity they have today.

Backpropagation is the key to training neural networks. Essentially, backpropagation takes the error at the output of a network and updates weights, within the network, based on how much they contributed to that error. By calculating the error from a sample and adjusting the weights accordingly over many, many iterations the network can be trained.

So in keeping with my previous project, I implemented a basic backpropogation algorithm in C for training on the popular MNIST dataset. I used a combination of the GNU Scientific Library and OpenBLAS for all the heavy number crunching. For the network itself I went with 2 hidden layers (4 total, including input and output layers) of 100 and 30 neurons. Below is the result after training on 50,000 images:


The green shows accuracy on training data and the blue shows the neural networks accuracy on a separate set of testing data. The x-axis shows the number of epochs, or the number of times the backpropagation went through all the training data and updated the network. Interestingly, after about 100 epochs the accuracy on the test data starts to decrease slightly. This is a sign that the network was overfitting to the training data. However, after around 180 epochs there is some disruption which ended up increasing the accuracy on both the training and testing data sets. Overall the accuracy was 99.74% and 97.14% on the training and testing data respectively.

As a final test, I got my lovely wife to draw any number on the computer (she chose '4'). I then fed this into the neural network to get see if it could identify what she wrote:


Clearly there is something to these neural networks after-all.

Thank you for reading. Please check out Michael's book if you want to know more about neural networks. Also check out the code I wrote for this network on my Github.


Tags:


Weekend Project - Cinnamon DE Applet


I’ve recently switched from using Xfce as my main desktop environment to Cinnamon. There are pluses and minuses to each but, so far, I am enjoying Cinnamon quite a lot. I wanted to personalize my desktop a little bit, beyond just changing the theme, and thought that making an applet would be a fun way to do this.

My favorite website to view Halo statistics stopped working recently. So my idea was to create a tiny applet where I could view current arena rankings for any player. And so 'minihalostats' was born over this past weekend.

The Cinnamon applet tutorial is pretty bad, to say the least. Not only is it outdated, but the code given in the tutorial won’t even run! There are also no links to further documentation or any additional reading. I ended up learning mostly from looking at the code of other people’s applets. The Cinnamon Spices Github repo was an excellent source for this.

Even given the frustrating lack of documentation I enjoyed the process and even learned a little bit of Javascript.

Code for 'minihalostats' is up on my Github.

Tags:


Webbased Digital Picture Frame


My wife and I moved to Germany from Canada some time ago and every once-in-a-while we get a little homesick. So I wanted to do a project that can help a little bit in this area.

I wrote a webpage where my family can upload pictures and a short message, if they want. The pictures are sent directly to my home server via an http post request. The request is parsed and the metadata is stored in an SQLite database, while the pictures themselves are stored in a directory. In the interest of security, I made sure that this directory is not accessible outside of my personal network. My sister does not want pictures of her children on the internet (a good decision in my opinion) so this seemed like a good option to accommodate that.

To display the pictures, a CGI script queries the SQLite database for a random image and uses it as the background in webpage. This is convenient because this allows me easily super-impose text using a bit of CSS. After all images have been displayed once, it resets and starts the cycle over again. Chromium is set up on the Raspberry Pi to auto-refresh the page every minute with a new picture.

For the display, I used the official Raspberry Pi touchscreen. The quality of the picture is, honestly, pretty bad and I would recommend shopping around for a nicer quality display if this project interests you.

All-in-all I’m quite happy with how it turned out and my wife definitely enjoys seeing new pictures of our family back home.

The code has also been uploaded to my Github.

Tags: